Abstract
This document includes project and device requirements, technical specifications, report samples and research citations. To download a sample of this report please visit Labfront Analytics - HRV Report.
1. Project Settings and Device Requirements
To access this report, you must ensure the following:
- Your wearable device supports BBI (beat-to-beat interval) data collection, examples of wearables supporting BBI include Garmin vívosmart 4 and Garmin Venu Sq.
- BBI data collection is enabled
2. Brief Introduction to Heart Rate Variability
Heart rate variability analysis is a non-invasive approach for accessing autonomic modulation. The autonomic nervous system (ANS) is generally conceived to have two major branches — the sympathetic system (SNS), associated with energy mobilization, and the parasympathetic system (PNS), associated with vegetative and restorative functions. In particular, when the sympathetic branch dominates for long periods of time, the energy demands on the system become excessive and ultimately cannot be met, eventuating in death [1].
Autonomic imbalance, characterized by a hyperactive SNS and a hypoactive PNS system is associated with various pathologic conditions, which may also influence HRV [1-3] (Table 1). Table 2 Introduces 10 commonly used HRV indices.
Table 1. Pathologic conditions associated with HRV [1-3].
|
Cardiovascular Disease |
Chronic Pathologic Conditions |
Mental Disorder [2-3] |
Lifestyle |
|
coronary heart disease |
hypertension |
anxiety |
smoking |
|
stroke |
diabetes |
stress [2] |
physical inactivity |
|
myocardial infarction |
cholesterol |
depression |
obesity |
|
heart failure |
|
alcohol dependence |
|
Table 2. 10 commonly-used HRV indices. [2-5]
|
Domain |
Measurement |
Unit |
Description |
Corresponding ANS |
|
Time Domain [4-5] |
SDRR |
ms |
Standard deviation of RR intervals. |
Both SNS & PNS |
|
RMSSD |
ms |
Root mean square of successive RR interval differences. |
PNS |
|
|
pnn 50 |
% |
Percentage of successive RR intervals that differ by more than 50 ms |
PNS |
|
|
Frequency Domain [4-5] |
VLF |
ms2 |
Power in the very low-frequency range (0.0033 – 0.04 Hz). |
Unclear* |
|
LF |
ms2 |
Power in the low-frequency range (0.04 – 0.15 Hz). |
Both SNS & PNS |
|
|
HF |
ms2 |
Power in the low-frequency range (0.15 – 0.4 Hz). |
PNS |
|
|
LF/HF |
ms2 |
Ratio of LF-to-HF power. |
Both SNS & PNS |
|
|
Nonlinear Domain [6-7] |
DFA a1 |
Detrended fluctuation analysis, describes short-term fluctuations [6]. |
Both SNS & PNS |
|
|
DFA a2 |
Detrended fluctuation analysis, describes long-term fluctuations [6]. |
|||
|
MSE |
|
Multiscale entropy, measures irregularity under different time scales [7]. |
||
|
*VLF is more strongly associated with all-cause mortality than LF or HF power, and may be fundamental to health [8]. |
||||
2.1 Usage of Heart Rate Variability
Results of HRV analysis are presented in standard long-term and short-term ways [4]. Table 3 and 4 describe how to derive HRV values. The long-term data refers to the data throughout an entire day. The short-term data refers to the data in a specific time period.
Table 3. Long-term HRV analysis (18~24 hrs).
|
HRV Method |
Usage |
|
Time-Domain |
Apply to the entire recording period in one day. |
|
Frequency-Domain |
Apply to each 5-mins segment, and then take average over the entire recording period. |
|
Nonlinear-Domain |
Apply to each 30-mins segment, and then take average over the entire recording period. |
Table 4. Short-term HRV analysis (³ 5 mins for time- and frequency- domain analyses; ³ 30 mins for nonlinear-domain analysis).
|
HRV Method |
Usage |
|
Time-Domain and Frequency-Domain |
Apply to each 5-mins segment, and then take average over the entire recording period. |
|
Nonlinear-Domain |
Apply to each 30-mins segment, and then take average over the entire recording period. |
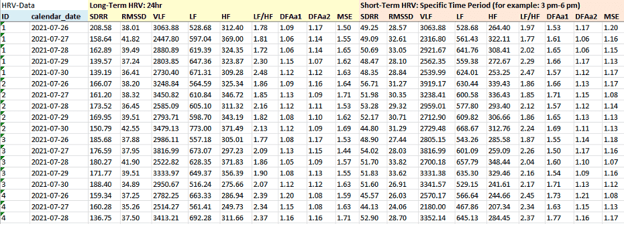
3. Example Report
The report includes HRV values of long-term (24 hrs) data or short-term data. The short-term data can be any specific time period specified by the researcher.
To download a sample of this report please visit Labfront Analytics - HRV Report.
4. Science Speak - Citations and References
HRV Standard Usage and General Introduction
Standards of measurement, physiological interpretation, and clinical use for HRV were set by the “European Society of Cardiology and the North American Society of Pacing and Electrophysiology” in 1996 [4]. A recent review of HRV usage and norms can be found in [5].
HRV & pathological conditions refer to [1-3]
HRV Values in General Population
This can be used for research to check if their HRV values are in normal range.
(a) HRV values of 21,438 healthy adults can be found in [8].
(b) HRV values of 782 healthy females and 1124 healthy males in different age groups can be found in a German research [9].
(c) HRV values of 735 healthy men and 2748 healthy women in different age groups in a Korean research [10].
4.1 References
[1] J. F. Thayer, S. S. Yamamoto, and J. F. Brosschot, “The relationship of autonomic imbalance, heart rate variability and cardiovascular disease risk factors,” International Journal of Cardiology, vol. 141, no. 2. pp. 122–131, May28, 2010, doi: 10.1016/j.ijcard.2009.09.543.
[2] H.-G. Kim, E.-J. Cheon, D.-S. Bai, Y. H. Lee, and B.-H. Koo, “Stress and heart rate variability: A meta-analysis and review of the literature,” Psychiatry Invest., vol. 15, no. 3, pp. 235–245, 2018.
[3] A. H. Kemp and D. S. Quintana, “The relationship between mental and physical health: Insights from the study of heart rate variability,” Int. J. Psychophysiology, vol. 89, no. 3, pp. 288–296, 2013.
[4] M. Malik, J. T. Bigger, A. J. Camm, R. E. Kleiger, A. Malliani, A. J. Moss, and P. J. Schwartz, “Heart rate variability standards of measurement, physiological interpretation, and clinical use,” Eur. Heart J., vol. 17, no. 3, pp. 354–381, 1996.
[5] F. Shaffer and J. P. Ginsberg, “An Overview of Heart Rate Variability Metrics and Norms,” Front. Public Heal., vol. 5, Sep.2017, doi: 10.3389/fpubh.2017.00258.
[6] C.-K. Peng, S. Havlin, H. E. Stanley, and A. L. Goldberger, “Quantification of scaling exponents and crossover phenomena in nonstationary heartbeat time series,” Chaos, vol. 5, no. 1, pp. 82–87, 1995, doi: 10.1063/1.166141.
[7] M. Costa, A. L. Goldberger, and C.-K. Peng, “Multiscale Entropy Analysis of Complex Physiologic Time Series,” Phys. Rev. Lett., vol. 89, no. 6, 2002, doi: 10.1103/PhysRevLett.89.068102.
[8] D. Nunan, G. R. H. Sandercock, and D. A. Brodie, “A quantitative systematic review of normal values for short-term heart rate variability in healthy adults,” PACE - Pacing and Clinical Electrophysiology, vol. 33, no. 11. pp. 1407–1417, Nov.2010, doi: 10.1111/j.1540-8159.2010.02841.x.
[9] A.Voss, R. Schroeder, A. Heitmann, A. Peters, and S. Perz, “Short-term heart rate variability - Influence of gender and age in healthy subjects,” PLoS One, vol. 10, no. 3, Mar.2015, doi: 10.1371/journal.pone.0118308.
[10] G. M. Kim and J. M. Woo, “Determinants for heart rate variability in a normal Korean population,” J. Korean Med. Sci., vol. 26, no. 10, pp. 1293–1298, Oct.2011, doi: 10.3346/jkms.2011.26.10.1293.