Abstract
To download a sample of the report please visit Labfront Analytics - Sleep Report.
This document includes project and device requirements, technical specifications, report samples and research citations.
1. Project Settings and Device Requirements
To access this report, you must ensure the following:
- Your wearable device supports BBI (beat-to-beat interval) data collection, examples of wearables supporting BBI include Garmin vívosmart 4 and Garmin Venu Sq.
- BBI data collection is enabled
- Garmin Connect is enabled
2. Report Details
Here is a summary of the data in this report, it is reported daily for each participant for the duration of the project.
|
Index |
Description |
Normal Values |
Unit |
Further Details |
|
tTS |
Daily Duration - Total Sleep (Light+Deep+REM+Awake) |
360-600 |
min |
Standard amount of sleep including awake periods. |
|
tLS |
Daily Duration - Light Sleep |
depends on tTS |
min |
|
|
tDS |
Daily Duration - Deep Sleep |
depends on tTS |
min |
|
|
tRS |
Daily Duration - REM Sleep |
depends on tTS |
min |
|
|
tW |
Daily Duration - Awake |
|||
|
rLS |
Daily Ratio - Light Sleep (Duration of tLS / tTS) |
<55% |
% |
Too much light sleep is an indicator of poor sleep quality, causing fatigue and difficulty waking. |
|
rDS |
Daily Ratio - Deep Sleep (Duration of tDS / tTS) |
20-60% |
% |
Deep sleep is most effective for eliminating fatigue. More deep sleep generally indicates better sleep quality, although very high levels of deep sleep over long periods may be a symptom of illness. |
|
rRS |
Daily Ratio - REM Sleep (Duration of REM Sleep / Total Duration) |
10-30% |
% |
Healthy REM sleep helps maintain mental well-being, boosts creativity, and relieves stress. |
|
rW |
Daily Ratio - Awake (Duration of Awake / Total Duration) |
% |
We may be waking at night for number of different reasons. Under normal circumstances, we should wake up fewer than 2 times per night. |
|
|
cLS |
Daily Counting - Light Sleep Stages |
<20 |
# |
Counts of each sleep fragment. |
|
cDS |
Daily Counting - Deep Sleep Stages |
<10 |
# |
Counts of each sleep fragment. |
|
cRS |
Daily Counting - REM Sleep Stages |
<10 |
# |
Counts of each sleep fragment. |
|
cW |
Daily Counting - Awake Stages |
<2 |
# |
Counts of each sleep fragment. |
|
tAD* |
Daily Duration - Apnea Detected |
min |
Periodic oscillations in RR intervals are often associated with prolonged cycles of sleep apnea. We detect and quantify these periods of both obstructive and central sleep apnea by identifying these oscillatory dynamics in the RR interbeat interval series.* |
|
|
rAD* |
Daily Ratio - Apnea Detected (Duration of Apnea / Total+Awake Duration) |
<15% |
% |
This ratio reflects both obstructive and central sleep apnea. Instead of a traditional apnea index of AHI<5 for normal people, we recommend that the detected apnea ratio be less than 15% as a normal value of threshold.* |
|
SC** |
Sleep Score |
This score is between 0 and 100 and is defined by the total sleep duration, deep sleep ratio, the degree of fragmentation of deep sleep ,and the ratio of apnea detected. A higher score indicates better sleep quality.** |
||
|
m0x |
The mean value of the Sp02 during sleep |
Pulse Oximetry is an estimation of peripheral blood oxygen saturation (SpO2%). The range is 0 to 100. |
||
|
p30Ox |
The 30th percentiles of Sp02 during sleep |
|||
|
p20Ox |
The 20th percentiles of Sp02 during sleep |
|||
|
p10Ox |
The 10th percentiles of Sp02 during sleep |
* tAD and rAD are metrics for both obstructive and central sleep apnea. The algorithm is developed from https://physionet.org/content/apdet/1.0.0/.
** The SC indices are decided from concepts introduced in the textbook of Principles and Practice of Sleep Medicine Edited by: Meir Kryger, Thomas Roth and William C. Dement and the recommendation of sleep experts.
3. Example Report
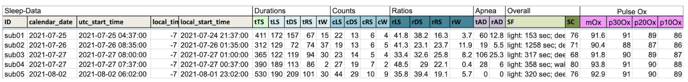 To download a sample of the report please visit Labfront Analytics - Sleep Report.
4. Science Speak - Citations and References
Compared with the sleep analysis results based on traditional indices identified from polysomnography (PSG), we use a complementary approach to quantify sleep quality in terms of sleep ‘‘stability,’’ originally implemented with an EEG morphological marker that has been termed the cyclic alternating pattern (CAP) [1], [2].
A high agreement was found in the classification of human sleep according to the CAP method between the detector and visual scoring [3]. Based on the concepts of CAP, we proposed a method, cardiopulmonary coupling (CPC), utilizing a continuous electrocardiographic (ECG) signal alone to quantify sleep stability [4]–[6].
The apnea detection algorithm was developed from PhysioNet, which is approved to correctly classify 26 of 30 subjects (86.6%), and correctly identified the presence or absence of sleep apnea in 13895 of 17045 minutes (82.1%).
By utilizing these sleep reports you can easily plot sleep fragmentation charts, perform statistical comparison of the duration of sleep stages, estimate the degree of sleep stage fragmentation, and study sleep apnea.
4.1 References
[1] M. G. Terzano, D. Mancia, M. R. Salati, G. Costani, A. Decembrino, and L. Parrino, “The Cyclic Alternating Pattern as a Physiologic Component of Normal NREM Sleep,” Sleep, vol. 8, no. 2, pp. 137–145, Jun. 1985, doi: 10.1093/sleep/8.2.137.
[2] M. G. Terzano and L. Parrino, “Origin and Significance of the Cyclic Alternating Pattern (CAP),” Sleep Med. Rev., vol. 4, no. 1, pp. 101–123, Feb. 2000, doi: 10.1053/smrv.1999.0083.
[3] A. C. Rosa, L. Parrino, and M. G. Terzano, “Automatic detection of cyclic alternating pattern (CAP) sequences in sleep: preliminary results,” Clin. Neurophysiol., vol. 110, no. 4, pp. 585–592, Apr. 1999, doi: 10.1016/S1388-2457(98)00030-3.
[4] R. J. Thomas, J. E. Mietus, C.-K. Peng, and A. L. Goldberger, “An Electrocardiogram-Based Technique to Assess Cardiopulmonary Coupling During Sleep,” Sleep, vol. 28, no. 9, pp. 1151–1161, Sep. 2005, doi: 10.1093/sleep/28.9.1151.
[5] R. J. Thomas et al., “Differentiating Obstructive from Central and Complex Sleep Apnea Using an Automated Electrocardiogram-Based Method,” Sleep, vol. 30, no. 12, pp. 1756–1769, Dec. 2007, doi: 10.1093/sleep/30.12.1756.
[6] G. Y. Yeh et al., “Enhancement of sleep stability with Tai Chi exercise in chronic heart failure: Preliminary findings using an ECG-based spectrogram method,” Sleep Med., vol. 9, no. 5, pp. 527–536, Jul. 2008, doi: 10.1016/j.sleep.2007.06.003.