---
title: Visualize Participant Data
description: Labfront's in-app data visualizer allows you to view your aggregated data easily. We'll show you how it works.
---
[Skip to content](https://help.labfront.com/visualize-data-in-labfront#main-content)
[Contact Support](https://help.labfront.com/kb-tickets/new?hsLang=en)
[](https://www.labfront.com)
- [Sign In](https://app.labfront.com/)
- [Back to Website](https://www.labfront.com/)
Open main navigation
Close main navigation
- [Sign In](https://app.labfront.com/)
- [Back to Website](https://www.labfront.com/)
- [Contact Support](https://help.labfront.com/kb-tickets/new)
How can we help you?
- There are no suggestions because the search field is empty.
1. [Help Center](https://help.labfront.com/?hsLang=en)
2. [Using Labfront](https://help.labfront.com/using-labfront?hsLang=en)
3. [Participant Management](https://help.labfront.com/using-labfront?hsLang=en#participant-management)
# Visualize Participant Data
## Labfront's in-app data visualizer allows you to monitor participant progress and dive deep into physiological data without needing to export files first.
---
In this article:
- [Viewing summary data (long-term trends)](https://help.labfront.com/visualize-data-in-labfront#summary-data)
- [Viewing time series data (granular daily detail)](https://help.labfront.com/visualize-data-in-labfront#time-series-data)
- [Customizing your dashboard](https://help.labfront.com/visualize-data-in-labfront#customize)
- [FAQs](https://help.labfront.com/visualize-data-in-labfront#faq)
---
### Viewing summary data
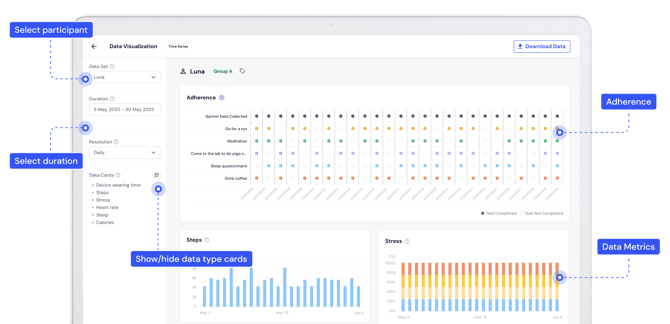
The Summary view is designed for tracking **Adherence** and long-term trends across days or weeks.
#### Access the visualizer
From your researcher dashboard, click the **Data Visualization** tab. By default, you will land on the Summary page. The **Adherence Card** shows a bird’s-eye view of task completion.
#### Select your data set
Use the left-hand sidebar to define what you want to see:
- ##### **Participant:** Choose a specific participant from the dropdown menu.
- ##### **Duration:** Select the date range you’d like to analyze.
- ##### **Resolution:** Choose how the data is aggregated.
- **Daily:** View data points day-by-day.
- **Weekly:** View data averaged by week.
- **Monthly:** *(Coming Soon)*.
##### **💡Pro Tip**
Click any circle on the Adherence chart to jump directly to the **Time Series** view for that specific day.
---
### Viewing time series data
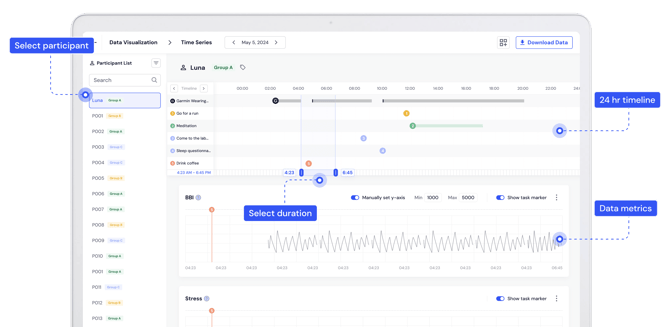
The **Time Series** view provides a detailed, minute-by-minute look at a participant’s 24-hour cycle.
#### Switch to time series
Click the **Time Series** toggle at the top of the Data Visualization page, or click a specific date from the Adherence card.
#### Navigate the timeline
- ##### **Select Date:** Use the date picker at the top center to change the day you are viewing.
- ##### **Switch Participants:** Use the **Participant List** on the left. You can use the **Search** bar or **Filter by Tag** (e.g., "Group A") to find participants quickly.
- ##### **Adjust Zoom:** Use the **Select Duration** slider located between the timeline and the data charts to zoom in on a specific window of time (e.g., 4:23 AM – 6:45 PM).
#### Analyze metrics
Scroll down to view specific data charts like **BBI (Beat-to-Beat Interval)**, **Stress**, **Sleep Actigraphy** or **Heart Rate**.
- ##### **Manual Y-Axis:** Toggle this on to set specific Min/Max values for a clearer view of data fluctuations.
- ##### **Event Markers:** Toggle **Show task marker** to see exactly when a participant performed a task (like "Drink Coffee" or "Meditation") relative to their physiological data.
---
### Customizing your dashboard
You can clean up your view by showing only the metrics relevant to your study.
1. Look for the **Data Cards** section (left sidebar in Summary view) or the **Layout icon ** (top right in Time Series).
2. Check or uncheck the metrics you wish to see (e.g., Steps, Stress, Sleep).
3. In Time Series view, click **Save Settings** to keep your preferred layout for future sessions.
---
### FAQs
#### **Can I visualize data for an entire group at once?**
Currently, the visualizer focuses on individual participant data. To see group-level trends, you'll need to export the data and use a statistical tool (like R, Python or Excel).
**I'm not seeing any data on the main visualization page. What's wrong?**
If you're using Garmin Direct data, it may currently only be available in the [**Time Series**](https://help.labfront.com/visualize-data-in-labfront#time-series-data) view within the Data Visualizer.
#### **Why is some data missing from the charts?**
Data only appears if the participant synced their device and completed the tasks. If the data is empty, the participant may not have worn their device or synced it recently.
#### **Can I change the order of the data cards?**
Currently, the cards appear in a fixed order. However, you can use the "Show/Hide" feature to remove any cards that aren't necessary for your analysis to make the dashboard easier to manage.
#### **Can I export the charts?**
Currently, the data charts can't be exported but that feature is in development.
#### **Is the Data Visualizer included with the Labfront Tester plan?**
Yes, access to the Data Visualizer is available with the Labfront Tester plan.
#### **Does the Data Visualizer include advanced data analysis tools?**
The Data Visualizer is intended for quick inspection and visualization of your data to help you review and confirm data quality. It doesn't currently offer advanced analysis tools, those are in development with our in-app analyzer. For full statistical analysis, you’ll need to export and analyze the raw project data in your own tools.
- [Getting Started](https://help.labfront.com/getting-started?hsLang=en#main-content)
- [Getting Started FAQs](https://help.labfront.com/getting-started?hsLang=en#getting-started-faqs)
- [Getting Started with Labfront Guide for Researchers](https://help.labfront.com/getting-started?hsLang=en#getting-started-with-labfront-guide-for-researchers)
- [Using Labfront](https://help.labfront.com/using-labfront?hsLang=en#main-content)
- [Project Creation, Setup and Edits](https://help.labfront.com/using-labfront?hsLang=en#project-creation-setup-and-edits)
- [Workspace](https://help.labfront.com/using-labfront?hsLang=en#workspace)
- [Participant Management](https://help.labfront.com/using-labfront?hsLang=en#participant-management)
- [Participant App](https://help.labfront.com/using-labfront?hsLang=en#participant-app)
- [Users and Accounts](https://help.labfront.com/using-labfront?hsLang=en#users-and-accounts)
- [Participant Experience](https://help.labfront.com/using-labfront?hsLang=en#participant-experience)
- [Garmin](https://help.labfront.com/garmin?hsLang=en#main-content)
- [General](https://help.labfront.com/garmin?hsLang=en#general)
- [Using Device](https://help.labfront.com/garmin?hsLang=en#using-device)
- [Movesense](https://help.labfront.com/movesense?hsLang=en#main-content)
- [General](https://help.labfront.com/movesense?hsLang=en#general)
- [Using Device](https://help.labfront.com/movesense?hsLang=en#using-device)
- [Data](https://help.labfront.com/movesense?hsLang=en#data)
- [Dexcom](https://help.labfront.com/dexcom?hsLang=en)
- [Data Metrics and Analysis](https://help.labfront.com/data-metrics-and-analysis?hsLang=en#main-content)
- [Data Management](https://help.labfront.com/data-metrics-and-analysis?hsLang=en#data-management)
- [Data Metrics](https://help.labfront.com/data-metrics-and-analysis?hsLang=en#data-metrics)
- [Data Analytics](https://help.labfront.com/data-metrics-and-analysis?hsLang=en#data-analytics)
- [Analytics Reports](https://help.labfront.com/data-metrics-and-analysis?hsLang=en#analytics-reports)
- [Pricing, Plans and Payment](https://help.labfront.com/pricing-plans-and-payment?hsLang=en)
- [Legal and Security](https://help.labfront.com/legal-and-security?hsLang=en)
- [Participant Resources](https://help.labfront.com/participant-resources?hsLang=en#main-content)
- [Participant Guides](https://help.labfront.com/participant-resources?hsLang=en#participant-guides)
- [Supporting Resources](https://help.labfront.com/supporting-resources?hsLang=en#main-content)
- [Grants, Funding and IRB Applications](https://help.labfront.com/supporting-resources?hsLang=en#grants-funding-and-irb-applications)
[](https://www.labfront.com)
Boston, MA, USA
[mailto:support@labfront.com](mailto:support@labfront.com)
Copyright © 2026, Labfront