📖 Getting Started With Labfront Guide for Researchers
- Part 1: Learn About Labfront
- Part 2: Build Your First Labfront Project
- Part 3: Onboard Participants and Track Adherence
- Part 4: View and Analyze Your Data
Visualize participant data
Labfront's in-app data visualizer allows you to monitor participant progress and examine physiological data without the need to export files first. It’s the fastest way to analyze trends in real-time.
1. Access the visualizer
From your researcher dashboard, click the Data Visualization tab.

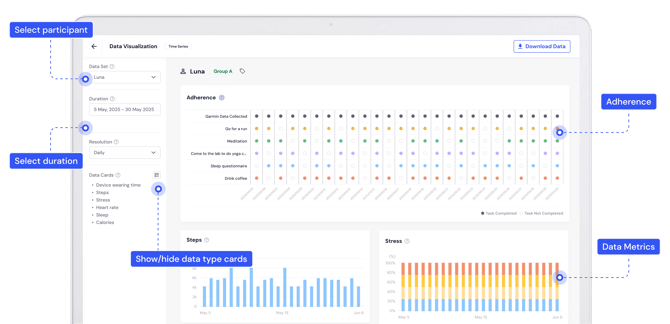
2. Summary view
Perfect for a "bird’s-eye view" of long-term trends across days or weeks. Use the sidebar to filter by participant, date range, or resolution (daily vs. weekly).
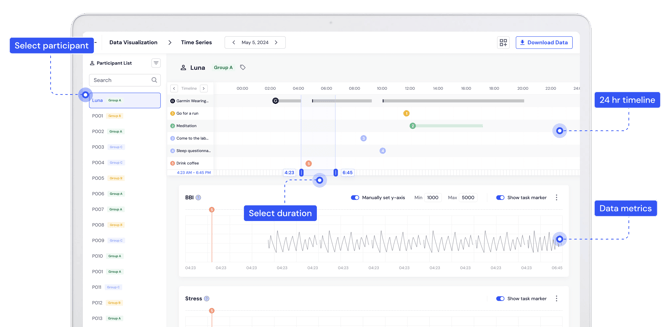
3. Time series view
Designed for granular, minute-by-minute analysis of a 24-hour cycle. View high-resolution charts for heart rate, BBI, stress, and sleep.
Download your data
When you're ready for analysis, Labfront organizes your physiological metrics and EMA responses into clean, research-ready CSV files.
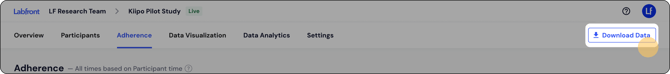
1. Navigate to download page
From your Workspace, select a Live Project and click the ![]() Download Data button in the top-right corner.
Download Data button in the top-right corner.
2. Customize your export
Tailor the file to your needs by selecting specific participants or custom timeframes (e.g., the last 7 days).

Note
Testing Plans are limited to a 30-day export window. Upgrade for full historical access.
3. Prepare and download
Click ![]() Download Data to start the process. You can leave the page; we’ll notify you on the dashboard when your ZIP file is ready.
Download Data to start the process. You can leave the page; we’ll notify you on the dashboard when your ZIP file is ready.

Once notified, return to the Data Download page and click Download This File.

Handling large datasets
For large-scale studies, web browsers can occasionally time out. We recommend using a Download Manager (like JDownloader) to allow for pausing, resuming, and multi-chunk downloading. Learn more→
Analyze your data
Once unzipped, your data is organized into a clear folder structure formatted for seamless import into SPSS, R, Python, or Excel. You can view sample data here.
To help you interpret your variables, please refer to our documentation:
-
Data Overview: Understand the Labfront folder structure.
-
Data Dictionary: Precise definitions for Heart Rate, BBI, Actigraphy, and ACC data.
-
EMA & Task Data: How to read your Questionnaire, Timer, and To-Do CSVs.
- Timestamps: How to understand timestamp data in Labfront.
Expert analytics support
If your team needs assistance with complex signal processing or advanced statistical modeling, the Labfront Analytics Team is here to help.
Led by Dr. Andrew Ahn (former Co-Director of Harvard's Center for Dynamical Biomarkers), our team brings decades of experience in physiological data analysis to your project.
Explore our analytics services→
Join the Analyzer beta!
We're currently developing an in-app data analyzer tool. If you'd like to be among the first to test this feature, join our pilot program→
You’ve finished the guide 🙌!
You're now ready to launch your study and capture high-quality data. If you still have questions, we’re here to support you: