In this article:
Before you begin
While this article focuses on tracking adherence from the Adherence page, the Overview page also includes tools to monitor overall progress and quickly send notifications. Learn more→
Navigating the adherence page
The Adherence Page helps you quickly understand how consistently participants are wearing their devices, syncing data, and completing tasks throughout your study. This guide walks you through each part of the dashboard so you can make the most of the adherence data.
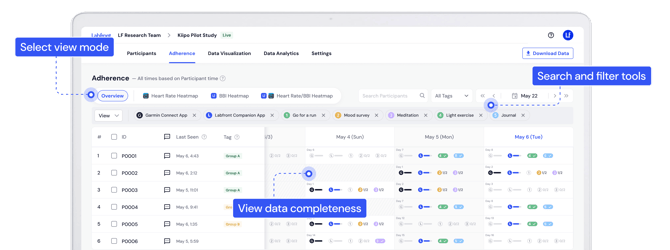
Key elements
-
Adherence view modes - choose between Overview (Default), Heart Rate Heat Map, BBI Heat Map, or Heart Rate & BBI Comparison Heat Map.
-
Participant data table - shows which data has been collected and which tasks have been completed. Click into a participant's data to view more detailed information.
-
Message - send messages to participants, such as sync reminders.
-
Last Seen - shows the most recent time the participant's Labfront Companion app connected to the internet.
-
Tags - added to participants to help you group and filter them.
-
-
Search and filtering tools - find a participant by ID, filter table by tags, navigate to specific dates.
Viewing participant data
Note
All timestamps on the Adherence dashboard follow each participant’s local time.
Overview (Default)
This view shows which participants are completing their assigned tasks and whether their data is syncing properly.

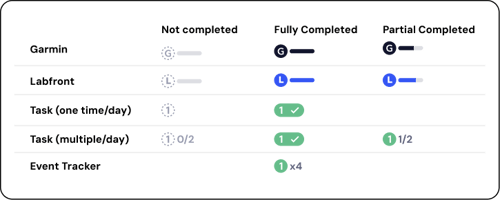
- The circle reflects if the data was synced and the progress bar reflects how much physiological data was collected.
- If the circle is filled but the bar is empty or low, the participant synced their device, but they may not be wearing it enough, or there may be an issue with device fit, sensor contact, or device condition.
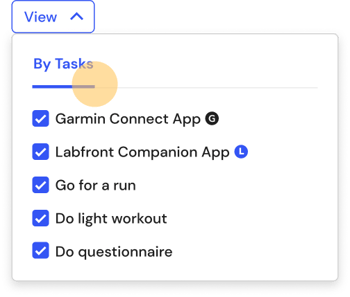
Task filtering
You can filter by specific tasks by selecting the View dropdown and choosing the tasks you want to review.
Garmin heart rate heat map
This heat map displays how much heart rate data the participant collected each day via the Garmin Connect app. It can be a good indicator of how long participants are wearing their device.
.png?width=670&height=314&name=HC_Adherence_GC%20heatmap%20(1).png)
A legend bar at the bottom shows daily heart rate durations (e.g., 4 hr, 8 hr, 12 hr). Darker colors indicate more data.
⚠️ Issue: Heart rate duration is lower than expected
If the participant is not wearing their smartwatch as often as they should be, we recommend sending them a message.
BBI heat map
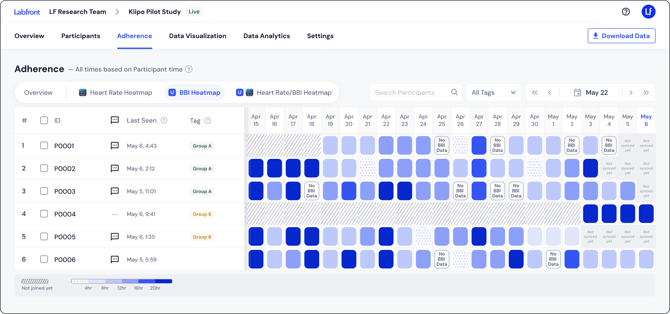
⚠️ Issue: "No BBI Data"
This indicates the device synced, but BBI was not available. The most likely cause is the participant not wearing the watch during that period.Heart rate / BBI comparison heat map
This combined view helps you compare Garmin heart rate wear time with BBI collection time. Garmin Connect heart rate data is on the left and Labfront BBI data is on the right.
.png?width=670&height=314&name=HC_Adherence_GC-BBI_heatmap%20(2).png)
⚠️ Issue: The BBI data is lower than the device wear time
Garmin uses different methods to measure heart rate vs. BBI, which can sometimes create discrepancies.
To improve accuracy, ensure:
- the device fits snugly,
- movement is minimized, and
- firmware is up to date.
Daily data per participant
Click on any participant’s daily data to see a detailed breakdown for that day.
You’ll see:
- recent activity, such as the last data upload time
- metrics collected from Garmin Connect and Labfront Companion,
- which tasks were completed and how many times,
- timestamps for each task, and
- durations for timer-based tasks.
.png?width=670&height=327&name=HC_Adherence_Sidebar%20(1).png)
💡 Tip
Filtering & search tools
To help you focus on specific participants or patterns, the Adherence Page includes:
Participant search
Use the search bar to find a participant by ID.
Tag filter
Filter participants by custom tags such as:
- Group A
- Group B
- Control
- Any other tag you’ve created
Date navigation
- Use the arrow buttons to move forward/backward in time day-by-day or weekly
- Click the calendar picker to jump to a specific date range
Messaging participants
Click the message icon next to any participant to send reminders or follow up on missing data. This is useful for quickly addressing adherence gaps.
Participants will:
- see the message in the Labfront app, and
- receive a push notification (if enabled in their phone settings).
Learn more about sending messages →
FAQs
How long after a participant syncs will their data appear on the dashboard?
After a participant syncs and uploads their data, it should appear on the dashboard in near real-time, though occasional short delays are possible.
How do I know if participants are wearing the devices correctly?
You can use the heat maps on the Adherence dashboard to track device wear time (via heart rate) and ensure participants are following the research protocol.
How often should I check the data?
For most studies, we recommend checking at least once a week to prevent data loss and ensure participants are complying with the study requirements.
If your data collection period is only a few days, we recommend checking at least once a day.
Why is there Garmin Connect data but no Labfront Companion data?
The most likely reason is that the participant is only syncing with the Garmin Connect app. Remind participants to open the Labfront Companion app. They should stay on the Labfront screen until they see the "Upload Completed" message.
If they're having difficulties syncing, they can refer to this troubleshooting guide.
Why is there Labfront Companion data but no Garmin Connect data?
-
Check sync habits - Ensure the participant is opening the Garmin Connect app regularly to allow the watch to sync its data. This is the most likely cause of this issue.
-
Verify permissions - The connection between Garmin and Labfront may have been revoked.
-
How to check: In Garmin Connect, go to Settings > Connected Apps. Ensure Labfront is listed and active.
-
-
Check for account mismatch - The participant might be logged into a different Garmin account than the one linked to Labfront.
-
How to check: In Garmin Connect, go to Settings > Profile & Privacy > Manage Garmin Connect Account to verify the email address. If the accounts don't match, the participant should log out of both apps and log back in using the correct, matching credentials.
-
Why is heart rate, BBI, and stress data missing, but steps, actigraphy, ACC, etc. are present?
If heart rate metrics are missing while accelerometer metrics (like steps) are present, the issue is usually related to the Optical Heart Rate (OHR) sensor.
Ensure the participant is wearing the watch and that it's fit snugly against the skin (about one finger-width above the wrist bone). If the sensor can’t detect a pulse, it won't generate BBI, stress, or sleep data.
In rare cases, the issue may be due to a sensor glitch. Ask the participant to reboot their Garmin device (power off and power back on).
Note: Rebooting will not delete any data, and they will not need a new invite code to continue the study.
Can I send reminders to participants automatically?
Yes. Projects with scheduled tasks automatically send a notification when a new task becomes available, and a reminder before the task expires.
Learn more about scheduled tasks→
Where can I find more resources to help participants troubleshoot common issues?
We provide detailed guides and videos in our Help Center to assist participants with common issues such as syncing devices and updating the app.